Salesforce Reports and Dashboards - A Complete Guide! : Amit Kumar
by: Amit Kumar
blow post content copied from Forcetalks
click here to view original post
What is a Report?
A report is a document that comprises data in a tabular or graphical format that has been generated for a specific time period. There are two types of Reports in Salesforce.
- Standard Reports.
- Custom Reports.
Standard Reports:
In Salesforce are those provided by salesforce.com These reports can't be erased, and they're mostly used to make custom reports.
There are several different sorts of standard reports. Some of them are as below
| Accounts | Activities | Contacts |
| Call Center Reports | Campaign | Salesforce CRM Content |
| Leads | Opportunities | Pricebook |
| Products | Assets | Administrative Reports |
Custom Reports:
A customs report is a detailed analysis of your transactions for a certain time period. You can create a report that includes all transactions for a certain credit card over a 3-day period, or a report that lists only specific categories of transactions (such as refused Sales and Authorizations) for all credit cards over a 5-day period.
Custom reports are of four types they are.
- Tabular Reports.
- Summary Reports.
- Matrix Report.
- Joint Report.
Dashboards:
Salesforce dashboards are visual representations of report data that can include Graphs, Bar charts, Pie Charts, Tables, Scatter Charts, Gauges, Metrics, Funnel Charts, and other elements.
Dashboard components are required to depict Salesforce dashboards. There are some of them.
| Charts | Gauges | Tables | Metrics |
| Scatter Chart | Funnel Chart | Donut Chart | Pie Chart |
| Line Chart | Vertical bar chart | Horizontal Bar Chart | Visualforce pages |
![]() Don't forget to check out: Subscribe to Dashboards and Reports (Salesforce Lightning Experience)
Don't forget to check out: Subscribe to Dashboards and Reports (Salesforce Lightning Experience)
Salesforce Report Builder:
Salesforce Report Builder is a sophisticated visual editor for reports that allows you to drag and drop items into place.
Create Reports Using Report Builder in Salesforce:
Reports and dashboards in Salesforce are organized into folders. For reports and dashboards, we may also build new custom folders.
As seen below, click on Reports.
The reports are organized into folders. We have an all-folder sidebar, which has a lot of subfolders, as shown above. Standard reports will be found in standard directories, whereas custom reports will be found in custom folders.
Click on the New report button as shown above.
We can use standard reports and also generate unique reports based on our requirements. After choosing a new report, the first step is to choose a report type. What is a report type, exactly? The link between a primary object and its related object is defined by the report type. There are two types of report types: standard and custom. The aforementioned reports are Standard report kinds. We'll build reports using Opportunities in this Salesforce tutorial, as illustrated below.
Using Salesforce Report Builder, we have a variety of options for creating reports. As illustrated above, there is a left narrow segment and a right wide section.
The information about all the fields is provided on the left narrow area, and the fields displayed are determined by the report type.
The fields in this table are all connected to opportunities, and we may use filters to choose only text fields, number fields, or date data.
![]() Check out another amazing blog by Amit here: Lead Assignment to the User in a Round Robin fashion | Salesforce Tutorial
Check out another amazing blog by Amit here: Lead Assignment to the User in a Round Robin fashion | Salesforce Tutorial
Click the All button to see a list of all fields.
- We have four filter options in the filter section: field filter, filter logic, cross filter, and row limit. Choose the case for which you wish to apply the filter.
- Add a filter to the report, as well as a data field for the reports to be displayed in.
- Select the OK button.
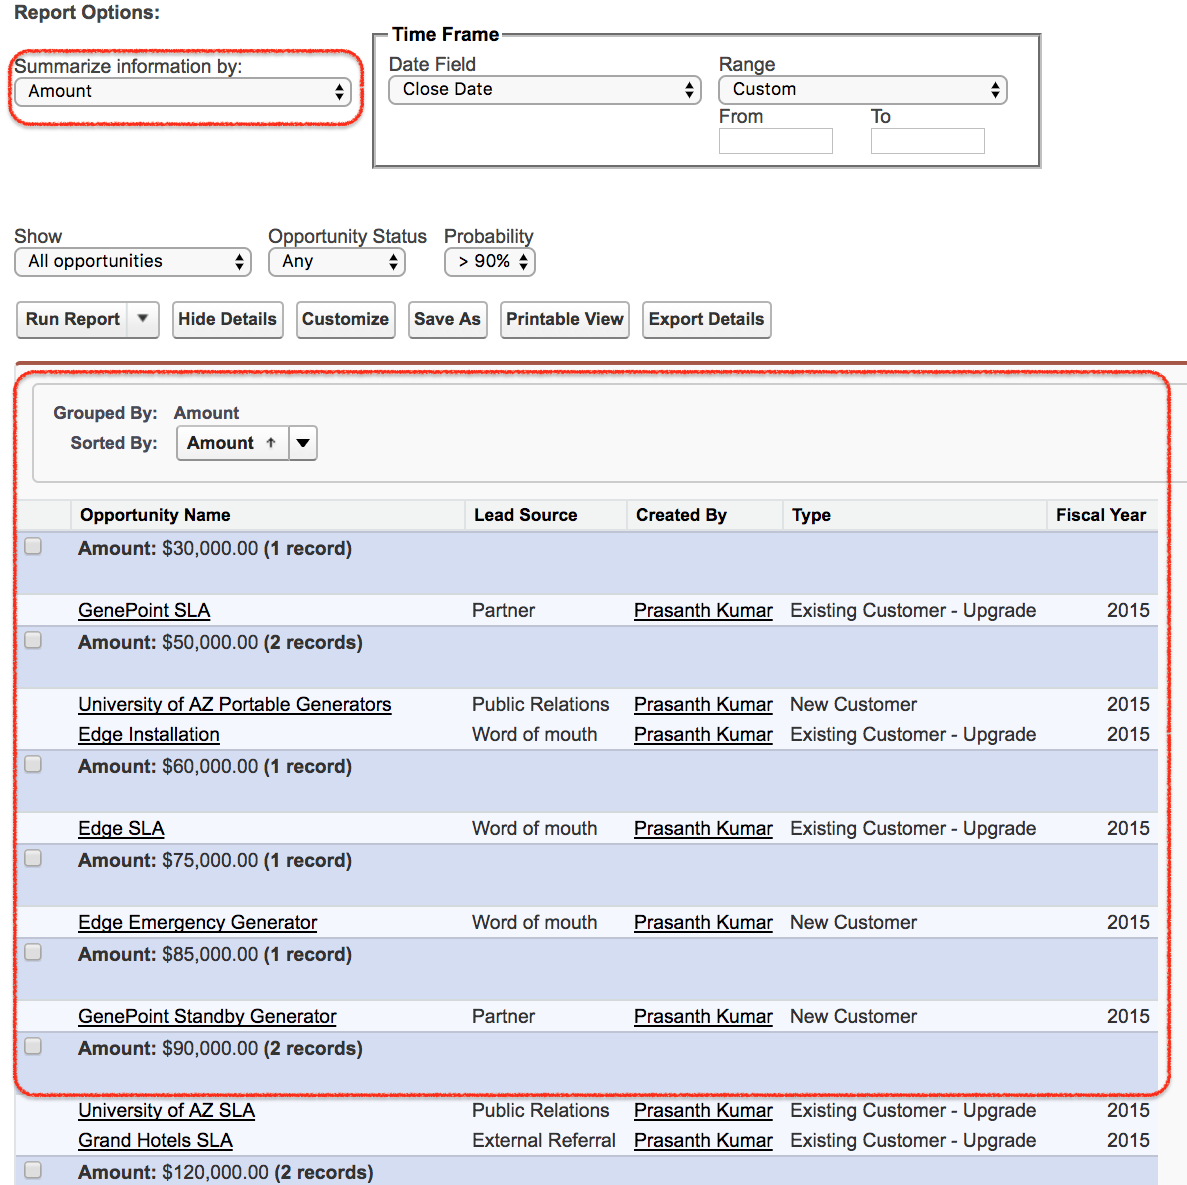
- We can choose the report format in the bottom area. From the drop-down menu, choose any report format.
- Remove the columns you don't want and add the fields from the left side. Drag and drop the preview tab from the left side.
- Finally, press the Report Run button.
We can also download a copy of the report.
The post Salesforce Reports and Dashboards - A Complete Guide! appeared first on Forcetalks.
July 05, 2022 at 09:26PM
Click here for more details...
=============================
The original post is available in Forcetalks by Amit Kumar
this post has been published as it is through automation. Automation script brings all the top bloggers post under a single umbrella.
The purpose of this blog, Follow the top Salesforce bloggers and collect all blogs in a single place through automation.
============================


Post a Comment